Polaris Announces Record Annual Financial Results And Update On Long Beach
March 1, 2016
VANCOUVER, British Columbia - Polaris Materials Corporation (TSX:PLS) (the "Company" or "Polaris") today reported the financial results for its fourth quarter and full year ending December 31, 2015. In addition, the company is pleased to announce the commencement of commercial operations at the Long Beach Terminal. All currencies are US dollars unless otherwise noted.
FINANCIAL HIGHLIGHTS
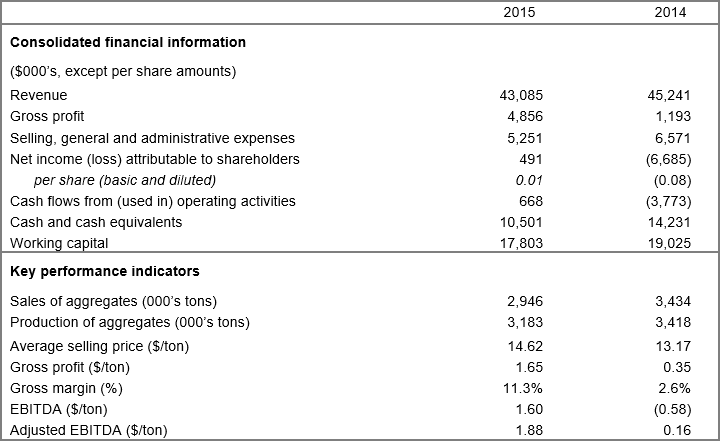
- Net income in 2015 of $0.9 million, compared to a net loss of $7.0 million in 2014
- Gross profit for 2015 of $4.9 million, compared to $1.2 million in 2014, is a new annual record as gross profit increased 307% from the prior year
- Gross profit per ton for 2015 of $1.65 represents a new annual record, improving by $1.30/ton versus the $0.35/ton recorded in 2014
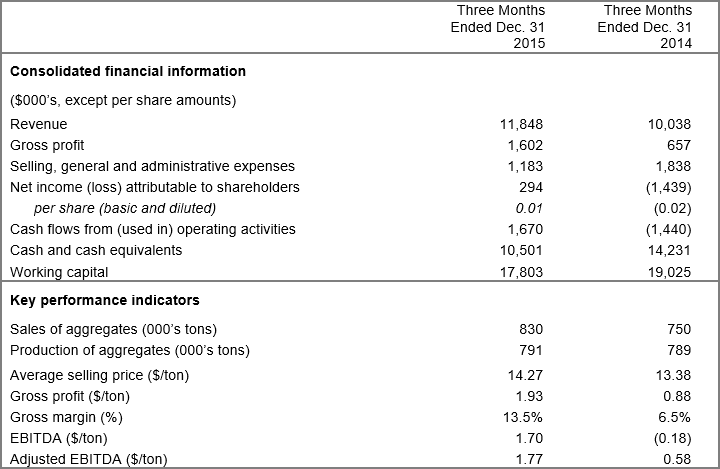
- Fourth quarter gross profit of $1.6 million ($1.93/ton) was an increase of 144% compared with $0.7 million ($0.88/ton) in the prior year quarter
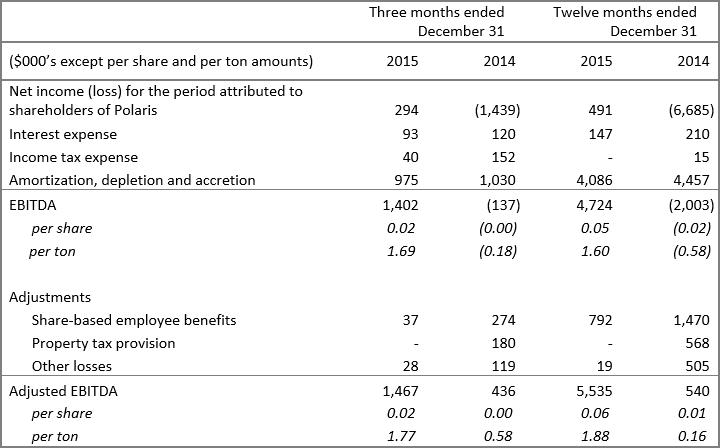
- The Company recorded its third full year positive adjusted EBITDA during 2015 of $5.5 million ($1.88/ton) compared with $0.5 million ($0.16/ton) in 2014
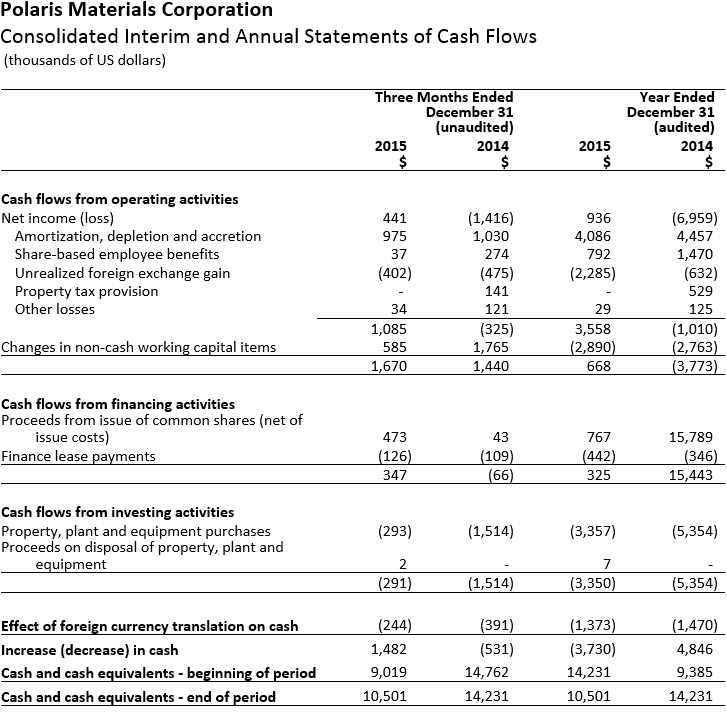
- Cash from operating activities for 2015 of $0.7 million ($0.23 per ton), was a $4.4 million increase compared with cash used for operations for 2014 of $3.8 million ($1.10 used per ton); positively impacted by price increases and operating efficiencies
ADDITIONAL UPDATES
- Commencement of Commercial Operations at our Long Beach Terminal
- We began commercial sales from our terminal in the Port of Long Beach on February 1, 2016 with regular sales to a customer in Los Angeles
- We have secured a sales agreement with an established ready-mix producer in L.A. to provide materials for several major construction projects, with deliveries expected through the balance of 2016
- We continue to work closely with ready-mix producers in LA to specify bids for projects which will benefit from Polaris' high quality aggregates
- Q1 2016 Sales Volume Outlook
- Since January, we have been working closely with customers in San Francisco and Long Beach to provide additional clarity on expected shipments for 2016
- As a result of recent and ongoing discussions, we have increased confidence in our 2016 outlook but are not revising our full year expectations at this time
- To manage volumes and control costs around planned maintenance at one of our delivery points, Q1 2016 sales volumes are currently expected to be in the range of 550,000 - 600,000 tons, versus 718,000 tons in Q1 2015
- Our customers will sell through inventories and will need to restock following completion of the planned maintenance, which has been factored into our full year volume outlook
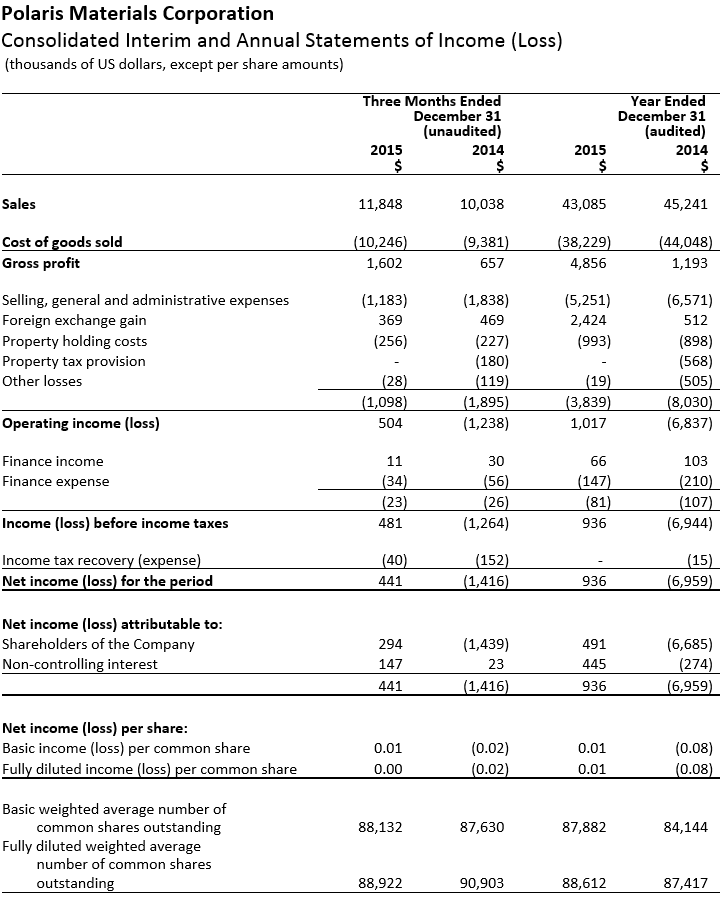
Sales of aggregates in the fourth quarter were 830,000 tons with revenue of $11.8 million, 11% and 18%, respectively, above the same quarter in 2014. For the full year ended December 31, 2015, sales of aggregates of 2.9 million tons and revenue of $43.1 million were 14% and 5%, respectively, below the same period in the previous year.
Ken Palko, President and CEO, commented: "We are pleased to report our first full year net income since becoming a public company, as well as record gross and operating margins and operating cash flow generation for the full year. The improved financial performance this year, and particularly in the third and fourth quarters, was driven by healthy average selling prices and reduced unit costs, together with the benefit of a favourable Canadian dollar exchange rate. Since announcing our outlook for the year on January 21, we have achieved the start of commercial operations at the Long Beach Terminal, with substantial progress in firming up orders and delivery schedules in both San Francisco and Los Angeles. We have increased confidence in our outlook for the year, in spite of Q1 shipments expected to be lower than a record Q1 in 2015, and we continue to advance discussions in all our served markets with respect to sales, marketing and logistics."
ANNUAL HIGHLIGHTS
The summary below should be read in conjunction with our 2015 audited annual financial statements and MD&A, published today on SEDAR and the company's website.
Sales of aggregates
Aggregate sales for 2015 of 2.9 million tons were a 14% decrease over 2014. Principally, the Company's aggregate sales were impacted by a management restructuring within its Strategic Alliance Partner which resulted in adverse aggregate distribution patterns outside previously agreed budgets. This situation has been addressed by the Company's partner which has now established a supply chain management group to provide better future coordination between the companies in planning aggregate sales and logistics. This was not a reflection of the underlying market demand and the Company saw a significant improvement in the fourth quarter.
Revenue and pricing
Revenue for the year ended 2015 decreased by 5% to $43.1 million, compared with $45.2 million in 2014. Despite lower than expected volumes, revenue benefited from selling price increases and positive sales mix. Base selling prices, net of fuel-surcharges, increased compared to 2014 and the proportion of sales delivered to San Francisco, which include freight charges as opposed to those sold ex-quarry, also increased compared to 2014.
Average selling price ("ASP") during 2015 of $14.62 per ton increased $1.45 per ton from $13.17 per ton in 2014. Compared with 2014, price variance was a favorable 4% due to price increases. A favorable sales mix variance of 3% was due to increased sales to customers with delivered pricing.
Revenue and ASP per ton are influenced on an annual basis by; base pricing, shipping fuel surcharges, the distribution of tonnage to the various California terminals, and the percentage between delivered and ex-quarry sales.
Cost of goods sold
Cost of goods sold for the year ended 2015 decreased by 13% to 38.2 million, compared with 44.0 million in 2014 whereas cost of goods sold per ton in 2015 increased slightly to $12.98 compared to $12.83 in 2014. Lower than expected volumes contributed to reduced overall cost of goods sold. Somewhat higher delivery costs due to increased sales mix to customers that include freight were partially offset by the declining Canadian dollar as quarry costs are incurred in Canadian dollars and translated in US dollars for reporting purposes.
Gross profit and gross margin
The gross profit for 2015 was $4.9 million or $1.65 per ton, a significant improvement over the gross profit of $1.2 million or $0.35 per ton in 2014. Similarly, gross margin improved to 11.3% in 2015 from 2.6% in 2014. As noted above, the improvements in gross profit and gross margin are largely due to selling price increases and the declining Canadian dollar.
Selling, general and administrative costs
During the year ended December 31, 2015, selling, general and administrative ("SG&A") expenses were $5.3 million, including $0.8 million of non-cash stock based compensation, compared with $6.6 million, including $1.5 million of stock based compensation, during 2014. SG&A during 2015 was 12.2% of sales compared to 14.5% of sales during 2014. Net of non-cash charges for stock based compensation, 2015 SG&A represented 10.3% of sales compared with 11.3% last year.
Net income (loss)
The net income attributable to shareholders during the year ended December 31, 2015 was $491,000 ($0.01 per share) compared to a net loss attributable to shareholders of $6.7 million ($0.08 per share, net loss) during the year ended December 31, 2014. The year-on-year net income (loss) comparison benefited from improving gross margins, price increases and the declining Canadian dollar.
EBITDA and Adjusted EBITDA
Adjusted EBITDA and EBITDA for 2015 also improved over year-on-year comparatives (see Non-IFRS Measures for details). Notably, the Company recorded its third consecutive year of positive adjusted EBITDA with the annual metric at $5.5 million ($1.88 per ton). Before adjusting for share-based employee benefits, EBITDA for 2015 of $4.7 million ($1.60 per ton) was an improvement of $6.7 million over the prior year comparative of, negative $2.0 million (negative $0.58 per ton).
QUARTERLY HIGHLIGHTS
The selected financial information set out below is based on and derived from the unaudited consolidated financial statements of the Company. For a more detailed table of quarterly results please refer to our 2015 MD&A, which can be found on SEDAR or the Company's website.
Fourth quarter 2015, compared to 2014
Aggregate sales for the quarter were 830,000 tons, an 11% increase from sales of 750,000 tons in the same quarter for 2014. Compared to the same quarter in the prior year, the current quarter saw the benefits of its Strategic Alliance partner establishing a supply chain management group to provide better coordination between the companies in planning aggregate sales and logistics, and an increase in underlying industry demand.
Revenue for the quarter increased by 18% to $11.8 million compared with $10.0 million in the comparable quarter for the previous year. Fourth quarter revenue benefited from both, further selling price increases and higher volumes compared to the prior year quarter. ASP during the fourth quarter increased $0.89 per ton to $14.27 from $13.38 in the same period of 2014.
Cost of goods sold in the quarter increased by 9.2% to $10.2 million compared with $9.4 million in the same quarter of the previous year. Cost of goods sold per ton of $12.34 was a decrease of $0.17/ton compared to $12.51/ton for the same period in 2014. The increased sales mix to customers that include delivery costs were substantially offset by the declining Canadian dollar as quarry costs are incurred in Canadian dollars and translated in US dollars for reporting purposes.
During the fourth quarter of 2015 the Company's gross profit was $1.6 million, or $1.93/ton, compared with a gross profit of $0.7 million or $0.88/ton in the comparative period. SG&A expenses represented 10.0% of sales and were $0.7 million lower than in the same period of 2014 when they represented 18.3% of sales. Net of non-cash charges for stock based compensation, SG&A represented 9.7% of sales in this current quarter compared with 15.6% last year.
Net income attributable to shareholders was $0.3 million ($0.01 per share) during the three months ended December 31, 2015, compared to net loss attributable to shareholders of $1.4 million ($0.02 per share loss) during the three months ended December 31, 2014. The positive result this quarter was principally attributable to the factors discussed above including; price increases, cost management, and the declining Canadian dollar.
CONFERENCE CALL AND WEBCAST DETAILS
The Company will host a conference call on Wednesday, March 2nd, 2016 at 8:00 am Pacific Time (11:00am Eastern). Details to access the call live are as follows:
- Via telephone, toll free, by calling 1-888-390-0546 in North America or +1-416-764-8688 in Toronto.
- Via webcast at: http://goo.gl/TdTcdi
The webcast will be archived for 14 days following the call at the above-noted link. The conference call will also be recorded and available for replay until Wednesday, March 16, 2016. To access the replay, dial 1-888-390-0541 or +1-416-764-8677 and use Playback Passcode 179066# to hear the recording.
About Polaris Materials Corporation:
Polaris Materials Corporation is engaged in the development and operation of construction aggregate quarries in Canada to supply distribution facilities in the United States through coastal shipping. The Company's active construction aggregate interests consist of its Orca Sand and Gravel Quarry in British Columbia and two associated receiving terminals in Richmond and Long Beach, California. The Company also owns the Black Bear Project located in close proximity to the Orca Quarry, and a controlling interest in the Eagle Rock Quarry Project, located on the south coast of Vancouver Island.
For further information, please contact:
Nicholas Van Dyk
Vice President, Investor Relations and Corporate Development
Polaris Materials Corporation
Tel: (604) 915-5000 Ext. 111
info@polarismaterials.com
Cautionary Note Regarding Forward Looking Statements
This press release contains "forward-looking statements" and "forward-looking information" within the meaning of applicable securities laws. These statements and information appear in this document and include estimates, forecasts, information and statements as to management's expectations with respect to, among other things, the future financial or operating performance of the Company, including increases in gross margins, increases in sales volumes, shipments and selling prices, costs of production, capital and operating expenditures, requirements for additional capital, government regulation of quarrying operations, environmental risks, reclamation expenses, and title disputes, the Canadian dollar compared to the US dollar, increases in Californian construction activity and US infrastructure funding, statements regarding potential new customers and the development of Black Bear. Often, but not always, forward-looking statements and information can be identified by the use of words such as "may", "will", "should", "plans", "expects", "intends", "anticipates", "believes", "budget", and "scheduled" or the negative thereof or variations thereon or similar terminology. Forward-looking statements and information are necessarily based upon a number of estimates and assumptions that, while considered reasonable by management, are inherently subject to significant business, economic and competitive uncertainties and contingencies. Readers are cautioned that any such forward-looking statements and information are not guarantees and there can be no assurance that such statements and information will prove to be accurate and actual results and future events could differ materially from those anticipated in such statements. Important factors that could cause actual results to differ materially from the Company's expectations are disclosed in the Company's continuous disclosure documents which are filed with Canadian regulators on SEDAR (www.sedar.com), including under the heading "Risks and Uncertainties" in the Company's Annual Report and under the heading "Risk Factors" in the Company's Annual Information Form. Such factors include, amongst others, the effects of general economic conditions, changing foreign exchange rates and actions by government authorities, uncertainties associated with legal proceedings and negotiations, industry supply levels, competitive pricing pressures, mineral resource and reserve estimates and the timing and development of the Black Bear project. The Company expressly disclaims any intention or obligation to update or revise any forward-looking statements and information whether as a result of new information, future events or otherwise, except as required by applicable law. All written and oral forward-looking statements and information attributable to us or persons acting on our behalf are expressly qualified in their entirety by the foregoing cautionary statements.
Non-IFRS Measures
EBITDA and Adjusted EBITDA
EBITDA, adjusted EBITDA, EBITDA per share and adjusted EBITDA per share ("EBITDA Metrics") are non-IFRS financial measures. EBITDA and EBITDA per share represent net income, excluding income tax expense, interest expense and amortization and accretion. Adjusted EBITDA and adjusted EBITDA per share better reflects the underlying business performance of the Company by removing certain non-cash adjustments from its calculation of EBITDA and EBITDA per share. The Company believes that the EBITDA Metrics trends are valuable indicators of whether its operations are generating sufficient operating cash flow to fund working capital needs and to fund capital expenditures. The Company uses the results depicted by the EBITDA Metrics for these purposes, an approach utilized by the majority of public companies in the construction materials sector. The EBITDA Metrics are intended to provide additional information, do not have any standardized meaning prescribed by IFRS and should not be considered in isolation or as a substitute for measures of performance prepared in accordance with IFRS. These measures are not necessarily indicative of operating profit or cash flow from operations as determined under IFRS. Other companies may calculate these measures differently.
The following table reconciles these non-IFRS measures to the most directly comparable IFRS measure.