Polaris Announces 2016 Annual Financial Results
March 14, 2017
VANCOUVER, British Columbia – Polaris Materials Corporation (TSX:PLS) (the “Company” or “Polaris”) today reported the financial results for its fourth quarter and full year ending December 31, 2016. All currencies are US dollars unless otherwise noted.
FINANCIAL HIGHLIGHTS
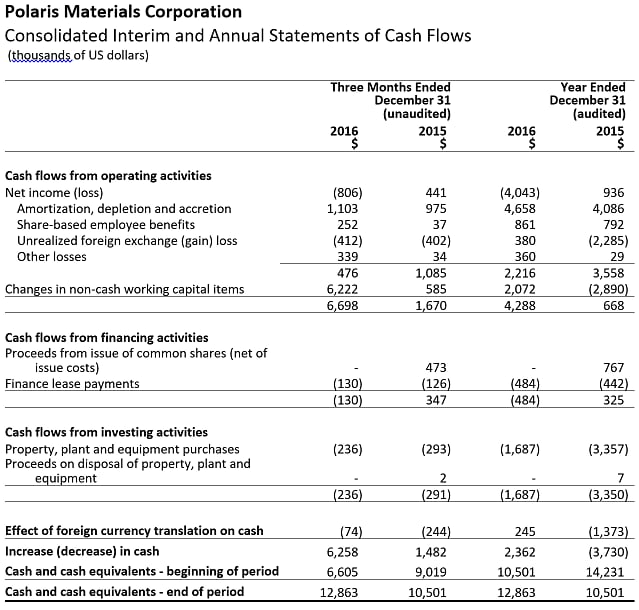
- Net increase in cash of $2.4 million and free cash flow of $2.6 million versus a net decrease in cash of $3.7 million and free cash flow usage of $2.7 million in 2015
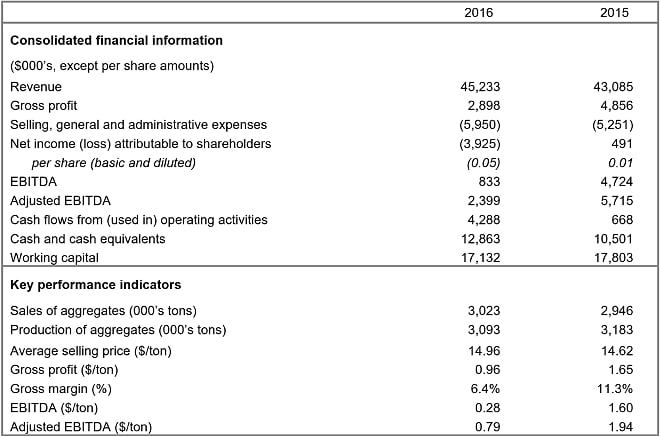
- 2016 revenue increased 5% to $45.2 million versus $43.1 million in 2015, driven by changes in mix, including the start-up of our Long Beach terminal
- Successful start-up of Long Beach terminal servicing prestigious major contracts in Los Angeles; higher unit costs during start-up of this operation impacted overall gross profit which declined to $2.9 million from $4.9 million in 2015
- Adjusted EBITDA of $2.4 million in 2016 versus $5.7 million in 2015 was impacted by Long Beach start-up, cost of management transition at Orca, other non-recurring charges as well as unrealized foreign exchange
- Net loss in 2016 of $4.0 million ($0.04/share loss) versus net income of $0.9 million ($0.01/share gain) in 2015, was driven primarily by the above-noted factors
The Company’s annual and fourth quarter results for 2016 reflect solid underlying operating performance, with unit costs at the Orca Quarry and for our northern California sales comparing favourably to 2015. Improvements in these areas were offset by costs related to the start-up of our Long Beach terminal, foreign exchange headwinds, non-recurring items including costs related to the management transition at Orca, resulting in a net loss for the year. Gross profit for 2016 declined approximately $2 million versus 2015, with the start-up of Long Beach adding fixed costs that were not fully recovered by sales at this terminal in 2016. Gross margins at Long Beach were also impacted by higher logistics costs which resulted from the deferral of certain customer projects in LA into 2017 and the resulting need to adapt our shipping schedule to meet customer requirements. As we continue to increase throughput at this terminal, we expect the increased volumes to dilute unit operating costs and to provide significant shipping cost savings, resulting in a significant improvement in gross margin contribution. While construction activity in 2016 was softer than originally expected, resulting in a modest decline in activity in the San Francisco Bay Area, the start-up of Long Beach allowed us to achieve a 3% increase in sales volumes versus 2015.
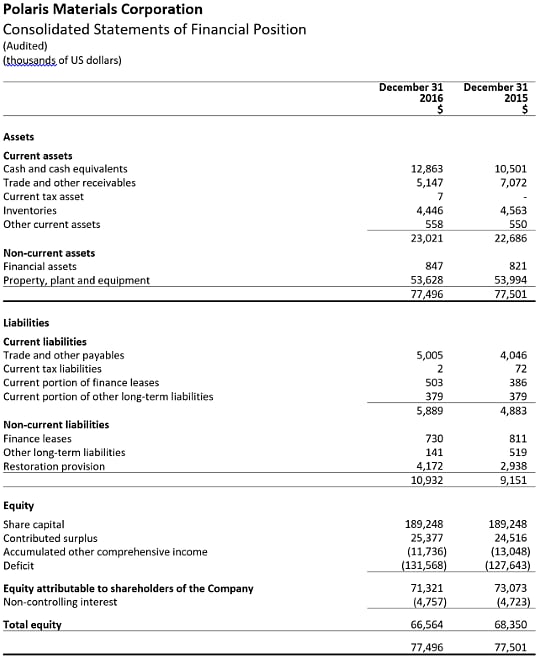
Looking forward to 2017, while we currently expect volumes could decline modestly due to non-renewal of an ex-quarry supply contract, increased same-site pricing with certain customers, increased volumes through our Richmond and Long Beach terminals, and the commencement of sales of our fine sand product by mid-year should result in an improvement in profitability versus 2016. We continue to be well funded to pursue growth opportunities, including Black Bear and potential new market developments, with over $12.9 million on our balance sheet as of December 31, 2016 and no long-term debt.
2017 KEY VALUE DRIVERS
- Strong financial position and robust balance sheet with a year-end cash balance of $12.9 million and no long-term debt (excluding equipment financing leases).
- Improvement in gross margins through improved same-site prices, increased volumes at our terminals, and the sale of our unique fine sand product.
- Continue to carefully manage operating costs at our quarry to ensure we realize on the benefits of the current weaker Canadian dollar.
- Identify new market opportunities along the west coast that allow us to realize the value of our high quality concrete aggregate.
- Position ourselves to take advantage of expected increases in infrastructure spending resulting from the FAST Act and other US federal and state-level infrastructure initiatives.
- Continue to work with our customers and end users to realize the significant value provided by using a high quality concrete aggregate in a performance concrete design.
We maintain our position of strength with superior aggregate quality, consistent and reliable operations, and proven logistics to several buoyant markets which continue to face a variety of supply issues. We are well positioned to capitalize on material shortages in the near-term on quality and longer term on availability in construction markets that continue to show signs of improvement. The Orca Quarry has substantial additional available production capacity that provides us the opportunity to achieve significant unit cost savings as we grow sales volumes past 4 million tons per annum in the coming years. Polaris’ operating expertise and differentiated product has enabled a marketing strategy that captures the value of our high quality aggregates for both ourselves and the end-users while providing attractive opportunities for increased unit profitability. The ongoing diversification of our product offerings and renewed management focus at the quarry, as well as our strong balance sheet positions the Company to pursue attractive bolt-on opportunities which can provide increased flexibility in product mix and market potential.
2017 OUTLOOK
Management currently anticipates that 2017 volumes in aggregate could decline approximately 5% from 2016 levels. Volumes into the San Francisco market are expected to decline approximately 15-20% as a result of the conclusion of sales to Hanson, however growth at our Long Beach terminal as well as the start of sales of fine sand in 2017 are expected to substantially replace this volume. We continue to pursue a number of attractive opportunities for additional sales in 2017 but these discussions remain subject to uncertainty as to timing and quantity.
We expect to see our gross margins improve in 2017, with incremental volumes at our Long Beach and Richmond terminals helping to absorb fixed costs at these operations, as well as the start of sales of our unique fine sand product. We continue to have success demonstrating the value proposition of our high performance concrete aggregate to customers in Los Angeles and will be working closely with our customers in the San Francisco Bay Area to achieve incremental value for our products in 2017.
We expect to continue to advance permitting and engineering of Black Bear during 2017 and have laid out an aggressive work plan which targets completion of the permitting process for this project by the end of 2017. We continue to work closely with our First Nations partners, local stakeholders and the BC Government to ensure that we develop this project in a responsible fashion, consistent with our current operations and past development practice.
Ken Palko, President and CEO, commented: “We are proud of our team’s accomplishments in 2016, with the successful start-up of our Long Beach terminal and the development of a healthy sales pipeline for 2017. At Orca, we achieved our 5th Stewart / O’Brian Provincial Safety Award for a calendar year free of lost-time accidents. The delay of certain projects from 2016 meant that we carried higher unit costs during the start-up phase of our Long Beach terminal than initially anticipated but we now anticipate these projects will contribute what is expected to be to a very healthy 2017 for this market. We’re also looking forward to the commencement of the fine sand sales contract as well as progress in the permitting of Black Bear later this year. Now that Long Beach is well along in its start-up, we will be working actively to identify our next market opportunity. With potential for improved margins and positive impact from changes in sales mix, we expect 2017 will be a solid year for our company and look forward to the exciting period ahead.”
ANNUAL HIGHLIGHTS
The summary below should be read in conjunction with our 2016 audited annual financial statements and MD&A, published today on SEDAR and the company’s website.
Sales of aggregates
Aggregate sales for 2016 of 3.0 million tons were a 3% increase over 2015. Aggregate sales increased as the start-up of our Long Beach terminal was offset by a modest decline in volumes in the San Francisco Bay Area, driven primarily by the wind-down of deliveries to Hanson as our contract with them reached a conclusion at the end of 2016.
Revenue and pricing
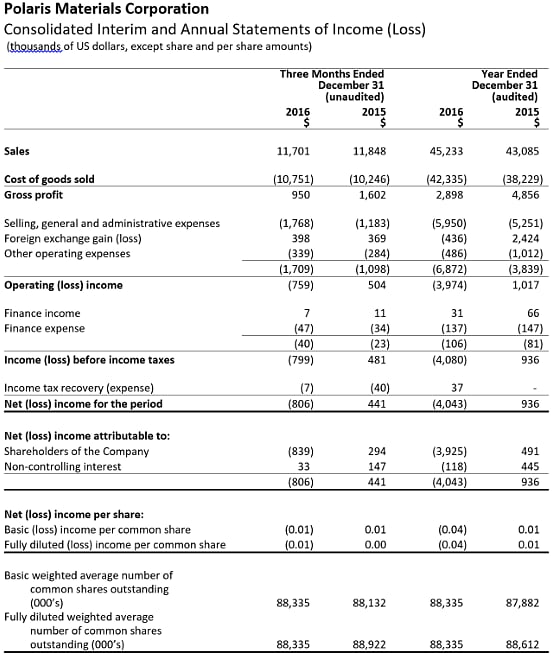
Revenue for the year ended 2016 increased by 5% to $45.2 million, compared with $43.1 million in 2015. Sales increased compared to the prior year due to increased delivered shipments into San Francisco and the Long Beach Terminal, which were offset by a decline in ex-quarry sales.
Average selling price (“ASP”) during 2016 of $14.96 per ton increased $0.34 per ton from $14.62 per ton in 2015. As a percentage of overall revenue, price variance was an unfavorable 1.8% due to decreasing fuel surcharges. A favorable sales mix variance of 4.4% was due to increased sales to customers with delivered pricing.
Revenue and ASP per ton are influenced on an annual basis by; base pricing, shipping fuel surcharges, the distribution of tonnage to the various California terminals, and the proportion of delivered and ex-quarry sales.
Cost of goods sold
Cost of goods sold for the year ended 2016 increased by 11% to $42.3 million, compared with $38.2 million in 2015. Cost of goods sold per ton in 2016 increased to $14.00 compared to $12.98 in 2015. Higher delivery costs due to an increased proportion of sales to customers that include freight was the largest contributor to the increase, as well as the addition of higher unit costs for sales via our Long Beach terminal due to higher shipping costs and costs related to the start-up of the facility.
Gross profit and gross margin
Gross profit for 2016 was $2.9 million or $0.96 per ton, compared with a gross profit of $4.9 million or $1.65 per ton in 2015. Gross margin was 6.4% in 2016 compared with 11.3% in 2015. The decline is largely due to increased terminal costs attributable to Long Beach.
Selling, general and administrative costs
During the year ended December 31, 2016, selling, general and administrative (“SG&A”) expenses were $6.0 million, including $0.9 million of non-cash stock based compensation and $0.3 million of non-recurring severance costs, compared with $5.3 million, including $0.8 million of stock based compensation and $0.2 million of non-recurring severance costs, during 2015. SG&A increased primarily due to the addition of management personnel to position us for future growth. SG&A during 2016 was 13.2% of sales compared to 12.2% of sales during 2015. Net of non-cash charges for stock based compensation, 2016 SG&A represented 11.3% of sales compared with 10.3% last year.
Net income (loss)
The net loss attributable to shareholders during the year ended December 31, 2016 was $3.9 million ($0.05 per share loss) compared to a net income attributable to shareholders of $491,000 ($0.01 per share, net income) during the year ended December 31, 2015. The year-on-year net loss comparison was impacted primarily by reduced gross profit as described above, and the impact of foreign exchange.
EBITDA and Adjusted EBITDA
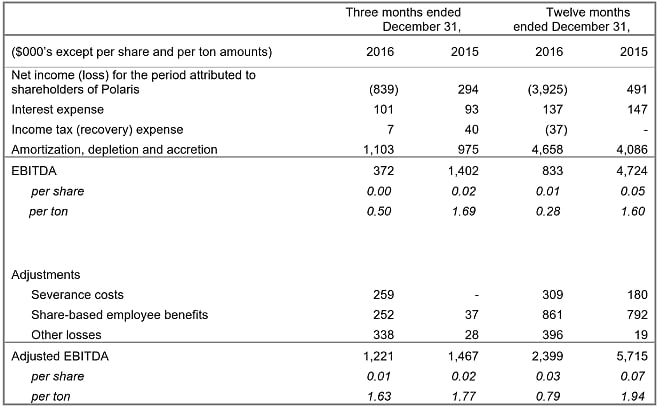
Adjusted EBITDA and EBITDA for 2016 was positive (see Non-IFRS Measures for details). Notably, the Company recorded its fourth consecutive year of positive adjusted EBITDA at $2.4 million ($0.79 per ton). Before adjustments for share-based employee benefits and non-recurring charges, EBITDA for 2016 was $0.8 million ($0.28 per ton), with the decline from 2015 levels driven primarily by the reduction in gross margin and increases in SG&A as outlined above.
QUARTERLY RESULTS
The selected financial information set out below is based on and derived from the unaudited consolidated financial statements of the Company. For a more detailed table of quarterly results please refer to our 2016 MD&A, which can be found on SEDAR or the Company’s website.
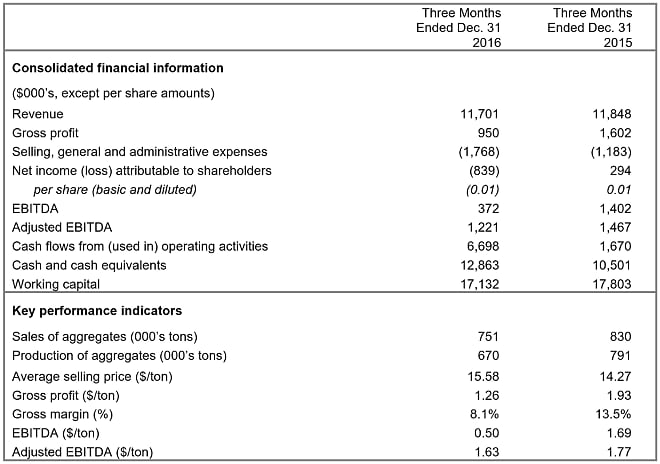
Fourth quarter 2016, compared to 2015
Aggregate sales for the quarter were 751,000 tons, a 10% decrease from sales of 830,000 tons in the same quarter for 2015. The difference amounts to approximately a single shipload and is accounted for by variances in delivery timing between quarters.
Revenue for the quarter decreased slightly by 1% to $11.7 million compared with $11.8 million in the comparable quarter for the previous year as lower volumes were offset by increased pricing. ASP during the fourth quarter increased $1.31 per ton to $15.58 from $14.27 in the same period of 2015, with the changes in ASP driven primarily by changes in mix during the quarter as ex-quarry sales to Hanson wound down.
Cost of goods sold in the quarter increased by 5.0% to $10.8 million compared with $10.2 million in the same quarter of the previous year. Cost of goods sold per ton of $14.32 was an increase of $1.98/ton compared to $12.34/ton for the same period in 2015. Higher delivery costs due to an increased proportion of sales to customers that include freight was the largest contributor to the increase, as well as the addition of higher unit costs for sales via our Long Beach terminal driven by a longer shipping distance and costs related to the start-up of the terminal.
During the fourth quarter of 2016 the Company’s gross profit was $1.0 million, or $1.26/ton, compared with a gross profit of $1.6 million or $1.93/ton in the comparative period. SG&A expenses represented 15.1% of sales and were $0.6 million higher than in the same period of 2015 when they represented 10.0% of sales. SG&A included $0.3 million of non-recurring charges related to the management transition at Orca in Q4. Net of non-cash charges for stock based compensation, SG&A represented 13.0% of sales in this current quarter compared with 9.7% last year.
Net loss attributable to shareholders was $0.8 million ($0.01 per share loss) during the three months ended December 31, 2016, compared to net income attributable to shareholders of $0.3 million ($0.01 per share, net income) during the three months ended December 31, 2015. The quarter was negatively impacted by non-recurring costs including those related to the transition at the Orca Quarry as well as the unfavourable impact of foreign exchange.
CONFERENCE CALL AND WEBCAST DETAILS
The Company will host a conference call on Wednesday, March 15, 2017 at 11:00am Eastern time (8:00am Pacific time). Details to access the call live are as follows:
- Via telephone, toll free, by calling 1-888-390-0605 in North America or +1-416-764-8609 in Toronto.
- Via webcast at: http://goo.gl/SFBkUX
The webcast will be archived for 14 days following the call at the above-noted link. The conference call will also be recorded and available for replay until Wednesday, March 29, 2017. To access the replay, dial 1-888-390-0541 or +1-416-764-8677 and use Playback Passcode 011675# to hear the recording.
About Polaris Materials Corporation:
Polaris Materials Corporation is engaged in the development and operation of construction aggregate quarries in Canada to supply distribution facilities in the United States through coastal shipping. The Company's active construction aggregate interests consist of its Orca Sand and Gravel Quarry in British Columbia and two associated receiving terminals in Richmond and Long Beach, California. The Company also owns the Black Bear Project located in close proximity to the Orca Quarry, and a controlling interest in the Eagle Rock Quarry Project, located on the south coast of Vancouver Island.
For further information, please contact:
Nicholas Van Dyk
Vice President, Investor Relations and Corporate Development
Polaris Materials Corporation
Tel: (604) 915-5000 Ext. 111
info@polarismaterials.com
Cautionary Note Regarding Forward Looking Statements
This press release contains "forward-looking statements" and "forward-looking information" within the meaning of applicable securities laws. These statements and information appear in this document and include estimates, forecasts, information and statements as to management's expectations with respect to, among other things, the future financial or operating performance of the Company, including increases in gross margins, increases in sales volumes, shipments and selling prices, costs of production, capital and operating expenditures, requirements for additional capital, government regulation of quarrying operations, environmental risks, reclamation expenses, and title disputes, the Canadian dollar compared to the US dollar, increases in Californian construction activity and US infrastructure funding, statements regarding potential new customers and the development of Black Bear. Often, but not always, forward-looking statements and information can be identified by the use of words such as "may", "will", "should", "plans", "expects", "intends", "anticipates", "believes", "budget", and "scheduled" or the negative thereof or variations thereon or similar terminology. Forward-looking statements and information are necessarily based upon a number of estimates and assumptions that, while considered reasonable by management, are inherently subject to significant business, economic and competitive uncertainties and contingencies. Readers are cautioned that any such forward-looking statements and information are not guarantees and there can be no assurance that such statements and information will prove to be accurate and actual results and future events could differ materially from those anticipated in such statements. Important factors that could cause actual results to differ materially from the Company's expectations are disclosed in the Company's continuous disclosure documents which are filed with Canadian regulators on SEDAR (www.sedar.com), including under the heading “Risks and Uncertainties” in the Company’s Annual Report and under the heading “Risk Factors” in the Company’s Annual Information Form. Such factors include, amongst others, the effects of general economic conditions, changing foreign exchange rates and actions by government authorities, uncertainties associated with legal proceedings and negotiations, industry supply levels, competitive pricing pressures, mineral resource and reserve estimates and the timing and development of the Black Bear project. The Company expressly disclaims any intention or obligation to update or revise any forward-looking statements and information whether as a result of new information, future events or otherwise, except as required by applicable law. All written and oral forward-looking statements and information attributable to us or persons acting on our behalf are expressly qualified in their entirety by the foregoing cautionary statements.
Non-IFRS Measures
EBITDA and Adjusted EBITDA
EBITDA, adjusted EBITDA, EBITDA per share and adjusted EBITDA per share (“EBITDA Metrics”) are non-IFRS financial measures. EBITDA and EBITDA per share represent net income, excluding income tax expense, interest expense and amortization and accretion. Adjusted EBITDA and adjusted EBITDA per share better reflects the underlying business performance of the Company by removing certain non-cash adjustments from its calculation of EBITDA and EBITDA per share. The Company believes that the EBITDA Metrics trends are valuable indicators of whether its operations are generating sufficient operating cash flow to fund working capital needs and to fund capital expenditures. The Company uses the results depicted by the EBITDA Metrics for these purposes, an approach utilized by the majority of public companies in the construction materials sector. The EBITDA Metrics are intended to provide additional information, do not have any standardized meaning prescribed by IFRS and should not be considered in isolation or as a substitute for measures of performance prepared in accordance with IFRS. These measures are not necessarily indicative of operating profit or cash flow from operations as determined under IFRS. Other companies may calculate these measures differently.
The following table reconciles these non-IFRS measures to the most directly comparable IFRS measure.