Polaris Announces Q2 2016 Financial Results and Update to 2016 Sales Outlook
August 9, 2016
VANCOUVER, British Columbia - Polaris Materials Corporation (TSX:PLS) (the "Company" or "Polaris") today reported the financial results for its second quarter ending March 31, 2016. All currencies are US dollars unless otherwise noted.
Q2 2016 HIGHLIGHTS
- Sales volumes in the quarter were the highest since Q3 2014, a 42% improvement over Q2 2015, with nearly all delivery points showing significant improvement versus prior year comparatives and Q1 2016
- First full quarter of operations at the Long Beach terminal with the successful delivery of aggregates for several large concrete foundation pours
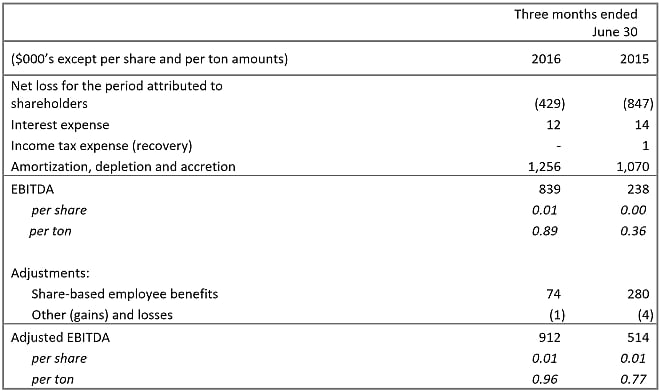
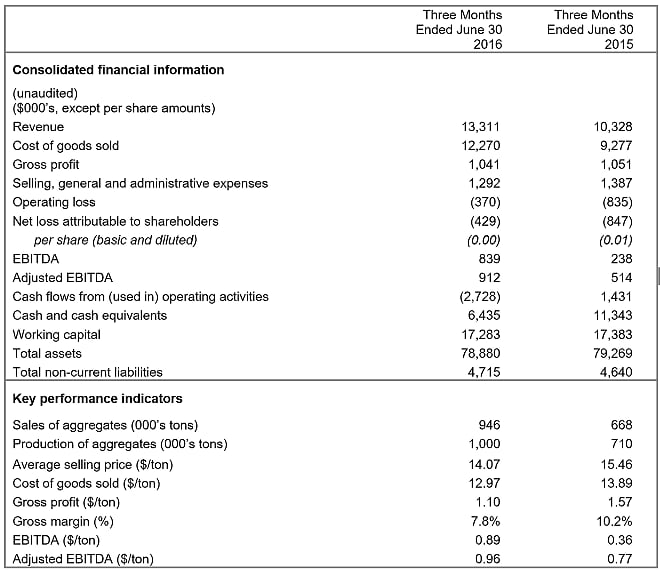
- Q2 2016 Adjusted EBITDA improved by 80% to $0.9 million, or $0.96 per ton, over the prior year comparative of $0.5 million, or $0.77 per ton
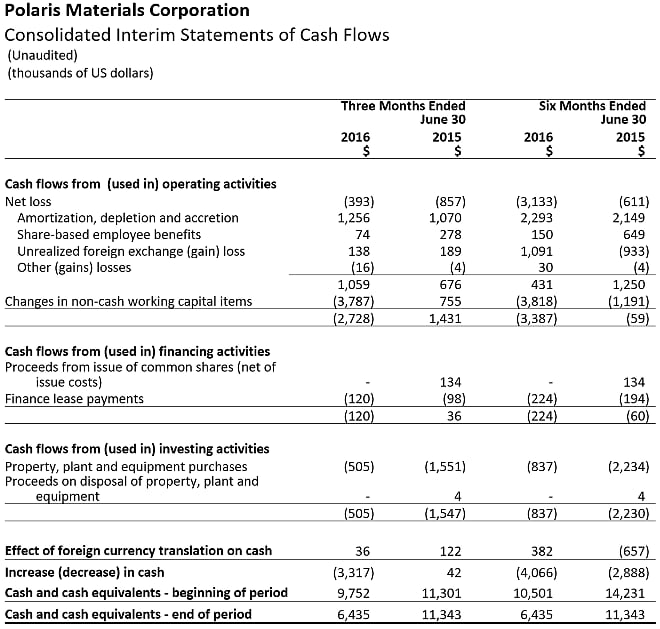
- During the second quarter the Company revised the payment terms with its major customer, which will accelerate cash collection compared with the prior year, however, this change temporarily increased quarter-end accounts receivable. In early July, the Company received a payment of $6.0 million to bring the account in agreement with the revised payment terms
- Work continued on the Black Bear preliminary resource report, with the report targeted for completion in the next several months
Adjusted EBITDA for the second quarter reflected the higher sales volumes in the quarter, offset by changes in sales mix and costs related to the start-up of our Long Beach terminal. These results were robust and consistent with the Company’s expectations for the full year. Construction activity both in California and throughout the US continues to show healthy levels of activity with a significant backlog of projects, particularly in Los Angeles, now progressing towards the start of construction. Ongoing discussions at multiple levels in the construction industry supply-chain have demonstrated the value added to major projects through the use of high performance concrete aggregates from Orca. We expect a positive pricing environment, as well as ongoing cost reduction programs, to contribute to healthy margins through the remainder of 2016.
The second quarter was the first full quarter of operations at the Long Beach terminal. High volumes of material were successfully delivered in a demanding schedule for Oceanwide Plaza’s foundation concrete pours. This type of scheduling and coordination is typically demanded by contractors participating in large, high specification, projects on which the Company intends to focus its marketing efforts. We are well positioned to supply these projects as they are favorable applications for our high performance concrete aggregate and proven high volume delivery capability.
Q2 2016 HIGHLIGHTS
Subsequent to the release of our Q2 2016 operating results on July 15, 2016, the Company determined that permitting and financing delays have resulted in the deferral of several significant planned projects in the LA market into late Q4 / early 2017. We continue to have a robust project pipeline for our high performance concrete aggregates but the delays mean that the majority of sales for these projects will now occur in 2017. As a result, we are revising our full year sales outlook for the Long Beach terminal to between 175,000 and 250,000 tons, and our overall sales outlook to 3.0 to 3.2 million tons. The shift in these projects will fit well with our 2017 activity in the high-end market of Los Angeles, and help offset the usual seasonal slowdown typical of Q1 in San Francisco.
Ken Palko, President and CEO, commented: “Sales volumes and revenues in Q2 2016 are our highest since 2014. Notwithstanding certain project delays in Long Beach, we continue to have a robust pipeline of major projects that we believe we are well positioned to secure over the next six to twelve months. Our Long Beach terminal will continue to ramp-up over the balance of the year and we expect unit costs to improve as we continue to increase throughput at the facility. In addition to building our volume through further sales, we will be working to advance discussions with our First Nations partners as well as complete the initial resource estimate for the Black Bear project, and look forward to sharing the results.”
SUMMARY OF QUARTERLY RESULTS
The selected financial information set out below is based on and derived from the unaudited consolidated interim financial statements of the Company. For a more detailed table of quarterly results please refer to our Q2 2016 MD&A, which can be found on SEDAR or the Company’s website.
Selling price and fuel surcharge indices
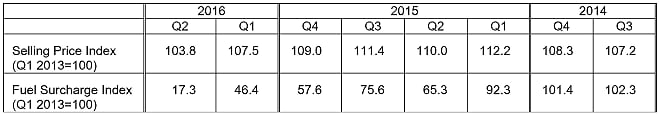
In the second quarter of 2016, the quarter-on-quarter average delivered selling price decreased by 3.4% as a consequence of passing through lower shipping fuel surcharges from the first quarter of 2016, which reflected the decreasing trend in the world crude oil price during the period.
Seasonality
The Company’s Orca sand and gravel quarry operates year-round, however, sales demand is seasonal due to the impact of poor weather conditions, particularly in the first (winter) quarter which have an impact on production volumes and demand for the Company’s products. As a consequence the Company’s financial results for any individual quarter are not necessarily indicative of results to be expected for that year. Sales and earnings are typically sensitive to regional and local weather, market conditions, and, in particular, to cyclical variations in construction spending.
SECOND QUARTER 2016, COMPARED TO 2015
Adjusted EBITDA
Adjusted EBITDA for the second quarter of 2016 of $0.9 million ($0.96 per ton) represented an improvement of $0.4 million, or 80%, over the prior year comparative of $0.5 million ($0.77 per ton). Additional tons sold in the current quarter reduced comparative quarrying costs per ton and limited the impact of costs associated with the first full quarter of operations at the Long Beach terminal.
Sales of aggregates
Aggregate sales for the current quarter were 946,000 tons, a 42% increase over sales of 668,000 tons in the second quarter of 2015. Shipments of the Company’s products increased compared to the prior year due to both increased delivered shipments into San Francisco and ex-quarry sales. Additionally, this was the first full quarter of operations for the Long Beach terminal.
Revenue and pricing
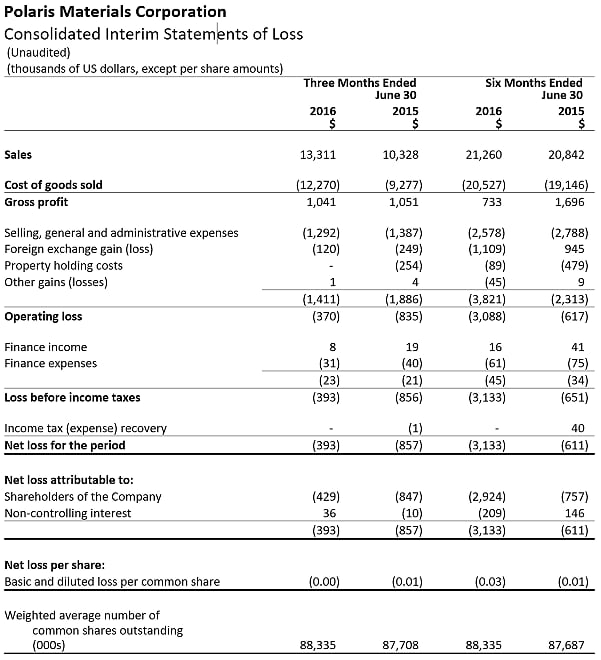
Revenue for the three months ended June 30, 2016 increased by 29% to $13.3 million, compared with $10.3 million for the three months ended June 30, 2015. Growth in revenue was driven by increased sales volumes, which were partially offset by reductions in revenue per ton as described below.
Average selling price (“ASP”) during the current quarter of $14.07 per ton was a decrease $1.39 per ton from $15.46 per ton in the same period of 2015. Year on year prices decreased $0.50 per ton or negative 9% due to lower fuel surcharge pass-through, which reflected the decreasing trend in the world crude oil price during the period. Sales mix variance decreased the ASP by $0.90 per ton due to increased ex-quarry sales that do not include delivery costs.
Revenue and ASP per ton are influenced on a quarter by quarter basis by base pricing, shipping fuel surcharges, overall market demand, the distribution of tonnage delivered to the various California terminals, and the varying percentage between delivered and ex-quarry sales.
Cost of goods sold
Cost of goods sold for the three months ended June 30, 2016 increased by 32% to $12.3 million, driven by higher sales volumes, compared with $9.3 million for the three months ended June 30, 2015. Cost of goods sold per ton for the current quarter decreased by $0.92 per ton to $12.97 per ton compared to the cost of goods sold per ton for the same period in 2015 of $13.89. The per ton decrease is mainly attributable to increased sales mix to customers that do not include delivery costs. This reduction was partially offset by the inclusion of the costs associated with the first full quarter of operations at the Long Beach terminal as well as the unfavourable impact of foreign exchange.
Gross profit
During the second quarter of 2016 the Company’s gross profit was $1.0 million or $1.10 per ton compared with a gross profit of $1.1 million or $1.57 per ton in the prior year period. As noted above, gross margin was impacted by sales mix and operating costs at the Long Beach terminal.
Selling, general and administrative costs
Current quarter selling, general and administrative (“SG&A”) expenses of $1.3 million decreased 7% compared with $1.4 million during the same quarter in 2015. The decrease is principally due to lower non-cash share-based employee benefits. Net of non-cash charges for stock based compensation, current quarter SG&A represented 9.2% of sales compared with 10.7% last year. Total SG&A during the quarter was 9.7% of sales compared to 13.4% of sales during 2015
Net loss
The Company incurred a reduced net loss attributable to shareholders of $0.4 million ($0.00 per share loss) during the three months ended June 30, 2016, compared to the net loss attributable to shareholders of $0.8 million ($0.01 per share loss) during the three months ended June 30, 2015. The current quarter net loss reflects the circumstances presented above.
CONFERENCE CALL AND WEBCAST DETAILS
The Company will host a conference call on Wednesday, August 10, 2016 at 8:00 am Pacific Time (11:00am Eastern). Details to access the call live are as follows:
- Via telephone, toll free, by calling 1-888-390-0546 in North America or +1-416-764-8688 in Toronto.
- Via webcast at: http://goo.gl/rfRAqK
The webcast will be archived for 14 days following the call at the above-noted link. The conference call will also be recorded and available for replay until Wednesday, August 24, 2016. To access the replay, dial 1-888-390-0541 or +1-416-764-8677 and use Playback Passcode 416406# to hear the recording.
About Polaris Materials Corporation:
Polaris Materials Corporation is engaged in the development and operation of construction aggregate quarries in Canada to supply distribution facilities in the United States through coastal shipping. The Company's active construction aggregate interests consist of its Orca Sand and Gravel Quarry in British Columbia and two associated receiving terminals in Richmond and Long Beach, California. The Company also owns the Black Bear Project located in close proximity to the Orca Quarry, and a controlling interest in the Eagle Rock Quarry Project, located on the south coast of Vancouver Island.
For further information, please contact:
Nicholas Van Dyk
Vice President, Investor Relations and Corporate Development
Polaris Materials Corporation
Tel: (604) 915-5000 Ext. 111
info@polarismaterials.com
Cautionary Note Regarding Forward Looking Statements
This press release contains "forward-looking statements" and "forward-looking information" within the meaning of applicable securities laws. These statements and information appear in this document and include estimates, forecasts, information and statements as to management's expectations with respect to, among other things, the future financial or operating performance of the Company, including increases in gross margins, increases in sales volumes (including in the Long Beach market), shipments and selling prices, costs of production, capital and operating expenditures, requirements for additional capital, government regulation of quarrying operations, environmental risks, reclamation expenses, and title disputes, the Canadian dollar compared to the US dollar, increases in Californian construction activity and US infrastructure funding, statements regarding potential new customers and the development of Black Bear. Often, but not always, forward-looking statements and information can be identified by the use of words such as "may", "will", "should", "plans", "expects", "intends", "anticipates", "believes", "budget", and "scheduled" or the negative thereof or variations thereon or similar terminology. Forward-looking statements and information are necessarily based upon a number of estimates and assumptions that, while considered reasonable by management, are inherently subject to significant business, economic and competitive uncertainties and contingencies. Readers are cautioned that any such forward-looking statements and information are not guarantees and there can be no assurance that such statements and information will prove to be accurate and actual results and future events could differ materially from those anticipated in such statements. Important factors that could cause actual results to differ materially from the Company's expectations are disclosed in the Company's continuous disclosure documents which are filed with Canadian regulators on SEDAR (www.sedar.com), including under the heading "Risks and Uncertainties" in the Company's Annual Report and under the heading "Risk Factors" in the Company's Annual Information Form. Such factors include, amongst others, the effects of general economic conditions, changing foreign exchange rates and actions by government authorities, uncertainties associated with legal proceedings and negotiations, industry supply levels, competitive pricing pressures, mineral resource and reserve estimates and the timing and development of the Black Bear project. The Company expressly disclaims any intention or obligation to update or revise any forward-looking statements and information whether as a result of new information, future events or otherwise, except as required by applicable law. All written and oral forward-looking statements and information attributable to us or persons acting on our behalf are expressly qualified in their entirety by the foregoing cautionary statements.
Non-IFRS Measures
EBITDA and Adjusted EBITDA
EBITDA, adjusted EBITDA, EBITDA per share and adjusted EBITDA per share (“EBITDA Metrics”) are non-IFRS financial measures. EBITDA and EBITDA per share represent net income, excluding income tax expense, interest expense and amortization and accretion. Adjusted EBITDA and adjusted EBITDA per share better reflects the underlying business performance of the Company by removing certain non-cash adjustments from its calculation of EBITDA and EBITDA per share. The Company believes that the EBITDA Metrics trends are valuable indicators of whether its operations are generating sufficient operating cash flow to fund working capital needs and to fund capital expenditures. The Company uses the results depicted by the EBITDA Metrics for these purposes, an approach utilized by the majority of public companies in the construction materials sector. The EBITDA Metrics are intended to provide additional information, do not have any standardized meaning prescribed by IFRS and should not be considered in isolation or as a substitute for measures of performance prepared in accordance with IFRS. These measures are not necessarily indicative of operating profit or cash flow from operations as determined under IFRS. Other companies may calculate these measures differently.
The following table reconciles these non-IFRS measures to the most directly comparable IFRS measure.